
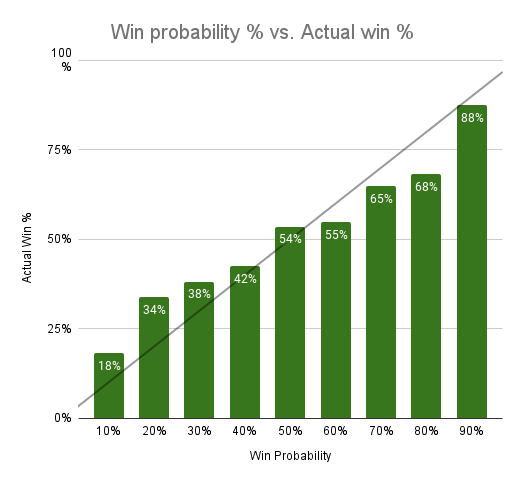
In our week 11 write-up, we asked for feedback on what features you’d like to see. The top response was how win probability compares to actual win percentage. So, ask and you shall receive! We took every win probability we published from the 2022 season up to Week 13, rounded them to the nearest 10%, counted up how many times these teams actually won, and divided by the total games for each 10%. This would give us the actual win percentage at each win probability. Take a look below:
How to read:
Each green block represents the published win probability from 10% up to 90%. The white number in the green block is the actual win percentage. In a perfect system, the two numbers would match. The black line is where the top of the green bars should be if it was a perfect world.
Takeaways:
The ends and the middle look about right. In between, there seems to be a trend of more upsets than the win probabilities will indicate. Those just happen to be where our money picks reside. The question is, why? It could be over time it’ll even out. It usually does, because the oddsmakers lose a lot of money if trends like this continue. We also are adjusting our formulas a bit to account for the “rake” that the oddsmakers take (i.e. the percentages don’t add up to 100% because they take a small commission on each bet).
What it means for you:
Overall, it’s relatively on track, so it means our picks are still good to use. If you believe in the trend, you should be more aggressive with the high risk money picks since the 20-30% picks seem to hit more often than we think. We’ll keep tracking this and seeing if we can make any adjustments to make the win probabilities more accurate.
Otherwise, we should look more into the other half of the picks equation: What the rest of our league is picking and if it matches up with the public picked data we have. That’s something we’ll work on next, but it is a little more challenging because it depends on your individual league. Stay tuned!
Here’s the data the chart above is based off of:
| Published Win Prob (Rounded to 10%) | Actual Wins | Total Games | Actual Win % |
|---|---|---|---|
| 10% | 4 | 22 | 18% |
| 20% | 27 | 80 | 34% |
| 30% | 45 | 118 | 38% |
| 40% | 81 | 191 | 42% |
| 50% | 61 | 114 | 54% |
| 60% | 105 | 192 | 55% |
| 70% | 76 | 117 | 65% |
| 80% | 58 | 85 | 68% |
| 90% | 21 | 24 | 88% |
› Forums › Win probability vs actual win percentage