For Confidence Pool Picks, I use the implied win probability that Moneylines gives us to create the “base picks” each week. The idea is to assign higher win probabilities higher confidence values. But is Moneyline even accurate?
I wanted to put this to the test. I analyzed data from the 2013 season and compared what Moneyline values predicted to what actually happened. To review, the Moneyline values are in the form of +150 or -300. Positive values mean you bet the value, in this case $150, to win $100. Negative values mean you bet $100 to win the value, in this case $300. You can then calculate an implied win probability based off these values, in other words “there’s an X% chance the favored team will win the game.”
I took all the Moneyline win probabilities, rounded it to the nearest 5%, and then compared it with what percentage of picked teams that actually won. Here is what it looked like:

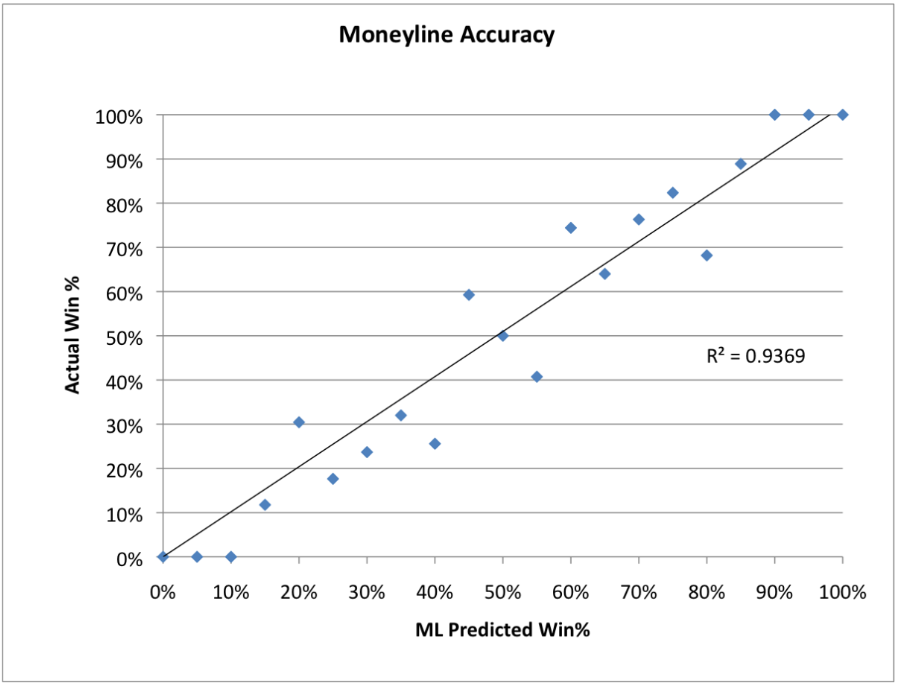
And graphed here, with the Moneyline predicted win probability on the x-axis and the actual win % on the y-axis:

A perfect model would have all the dots on the line. The Moneyline predictions look pretty good.
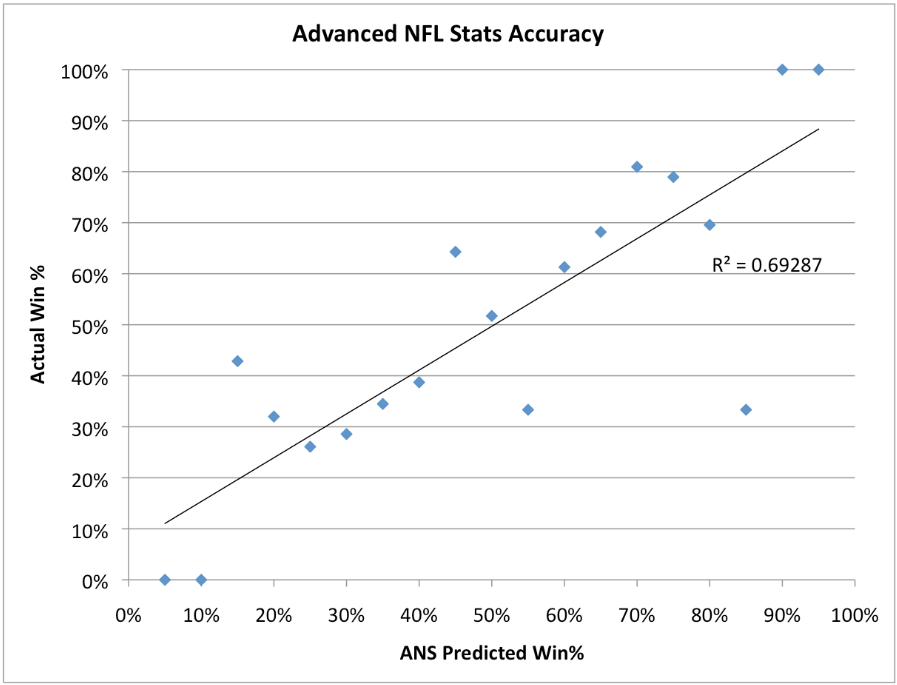
Last year, I also used an Advanced NFL Stats (now Advanced Football Analytics) model, thinking it would do a better job of predicting the games because it took the mood swings of the crowd out of it. So I also ran the same analysis on it. However, there were less data points because the model doesn’t start until Week 5 because it uses previous data in its calculations. I rounded each bucket to the nearest 10% instead of nearest 5%, and got the following:

Not as accurate as the Moneyline picks, which is surprising to me because this model is constantly being reviewed and updated for accuracy. It may be that the Moneyline picks take into account last minute injury situations, or the model still needs more refining.

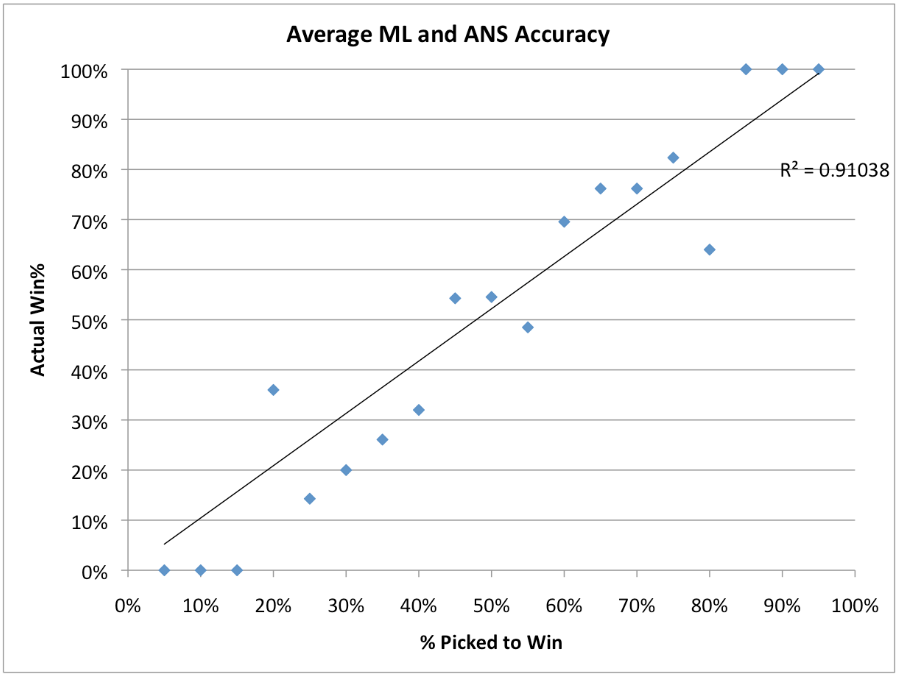
For the final confidence points, I used an average of the ANS and Moneyline probabilities. Here’s what the accuracy of using this method looks like:
Not too bad, but at best only as good as the Moneyline picks alone. So for 2014, I’m going to stick with just the Moneyline values. It simplifies things and maybe just as good.
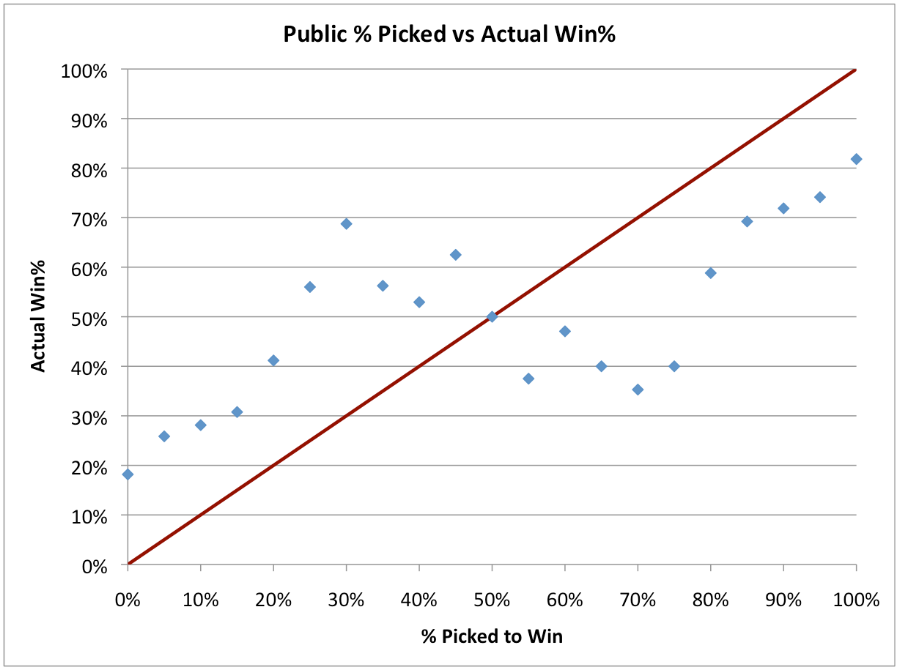
Just for fun, I figure I’d check to see how good the people are in predicting win probability. So I did the same plot, taking the percentage of the people who picked that team to win as the predicted win probability. Something interesting came out:

More people picked a team to win than the team actually won. Most people were overoptimistic or risk averse; not many brave souls would go against the crowd. What this means to our pick strategy I’m not sure yet, but it’s an interesting phenomenon.
Running a “hindsight is 20/20” analysis, I figured out how many total points you would’ve won if you went with the straight Moneyline implied probabilities and didn’t pick any upsets. And the answer is:
1456.
Would that have won your league?
